Answer:-
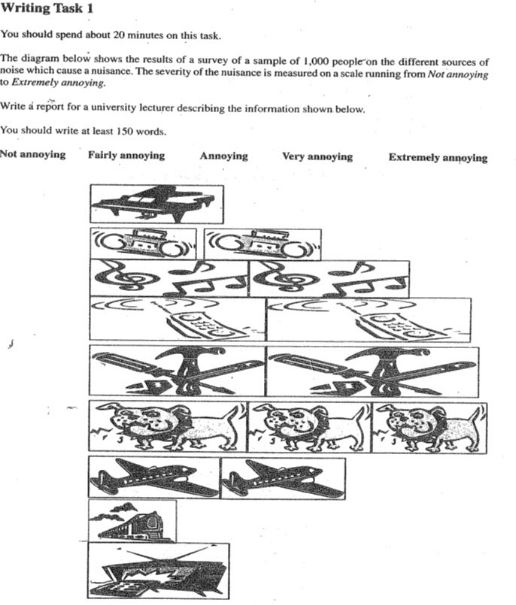
The diagram depicts the outcomes of survey conducted on one thousand people to know about their rating for sources of noise.
It is clear that sources of noise were rated on a scale which was divided into five groups. There was nothing in not annoying category. Whilst, three sources namely piano, train and television were grouped in fairly disturbance category. In this group, nuisance created by television was more irritating than the other two.
It further reveals that only radio was kept in annoying group. Then, music system created more disturbance than aeroplane in very annoying category. Lastly, nuisance produced by ringing mobile phones, hand tools and dog barking was most problematic and fell under last category ,that is, extremely annoying.
Thus, it is therefore clear that barking of dogs generated maximum inconvenience whilst, minimum irritation was produced by pianos.
Vocab:-
Depicts- Reveals, shows, delineates
Outcomes-Results
Category-Group
Annoying - Disturbance, nuisance, irritation

No comments:
Post a Comment