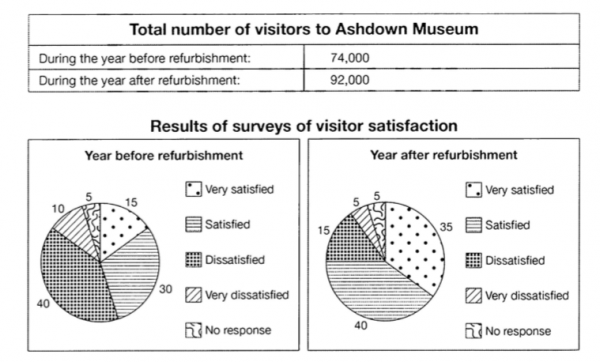
The table below shows the numbers of visitors to Ashdown museum during the year before and the year after it was refurbished. The charts show the result of surveys asking visitors how satisfied they were with their visit, during the same two periods.
Summaries the information by selecting and reporting the main features, and make comparisons where relevant.
The tabular chart delineates the number of people who visited Ashdown museum in the year before and the year after the redecoration. Visitors were surveyed about their satisfaction during their visit and the result of the survey are revealed in the pie charts.
In the year before refurbishment, total visitors numbers stood at 74000 with majority of dissatisfied visitors whereas, changed infrastructure helped to attract 18000 more people in the later year with lion's share of satisfied people. Before renovation, just over a third people were happy with their museum visit and half of this were very satisfied.
The renovation work had positive impact on satisfaction as 40% people stated their visit as satisfactory and 35% as very satisfactory. In the first time period, half of the total museum goers were dissatisfied but the proportion of people dissatisfied with museum was 15% in the second time period. Likewise this, very displeased visitors halved in the given period. In both the given year, a minority of people did not respond to the survey.

No comments:
Post a Comment